Suppose that a patient is to be screened for a certain disease or medical condition. There are two important questions at the outset. How accurate is the screen or test? For example, at the outset, what is the probability of the test giving the correct result? The second question: once the patient obtains the test result (positive or negative), how reliable is the result? These two questions seem one and the same. Confusing these two questions as the same is a common misconception. Sometimes even medical doctors can get it wrong. This post demonstrates how to sort out these questions using Bayes’ formula or Bayes’ theorem.
Example
Before a patient is screened, a relevant question is on the accuracy of the test. Once the test result comes back, an important question is on whether positive result means having the disease and negative result means healthy. Here’s the two questions that are of interest:
- What is the probability of the test giving a correct result, positive for someone with the disease and negative for someone who is healthy?
- Once the test result is back, what is the probability that the test result is correct? More specifically, if a patient is tested positive, what is the probability that the patient has the disease? If a patient is tested negative, what is the probability that the patient is healthy?
Both questions involve conditional probabilities. In fact, the conditional probabilities in the second question are the reverse of the ones in the first question. To illustrate, we use the following example.
Example. Suppose that the prevalence of a disease is 1%. This disease has no particular symptoms but can be screened by a medical test that is 90% accurate. This means that the test result is positive about 90% of the times when it is applied on patients who have the disease and that the test result is negative about 90% of the time when it is applied on patients who do not have the disease. Suppose that you take the test and the test shows a positive result. Then the burning question is: how likely is it that you have the disease? Similarly, how likely is it that the patient is healthy if the test result is negative?
The accuracy of the test is 90% (0.90 as a probability). Since there is a 90% chance the test works correctly, if the patient has the disease, there is a 90% chance that the test will come back positive and if the patient is healthy, there is a 90% chance the test will come back negative. If a patient tested positive, wouldn’t it mean that there is a 90% chance that the patient has the disease?
Note that the given number of 90% is for the conditional events: “if disease, then positive” and “if healthy, then negative.” The example asks for the probabilities for the reversed events – “if positive, then disease”and “if negative, then healthy.” It is a common misconception that the two probabilities are the same.
Tree Diagrams
Let’s use a tree diagrams to look at this problem in a systematic way. First let be the event that the patient being tested is healthy (does not have the disease in question) and let
be the event that the patient being tested is sick (has the disease in question). Let
denote the event that the test result is positive if the patient has the disease. Let
denote the event that the test result is negative if the patient is healthy.
Then and
. These two conditional probabilities are based on the accuracy of the test. These probabilities are in a sense chronological – the patient either is healthy or sick and then is being tested. The example asks for the conditional probabilities
and
, which are backward from the given conditional probabilities, and are also backward in a chronological sense. We call
and
forward conditional probabilities. We call
and
backward conditional probabilities. Bayes’ formula is a good way to compute the backward conditional probabilities. The following diagram shows the structure of the tree diagram.
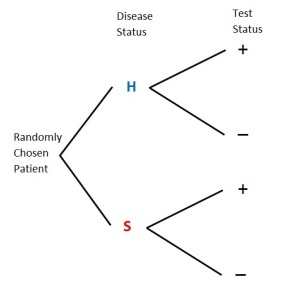
At the root of the tree diagram is a randomly chosen patient being tested. The first level of the tree shows the disease status (H or S). The events at the first level are unconditional events. The next level of the tree shows the test status (+ or -). Note that the test status is a conditional event. For example, the + that follows H is the event and the – that follows H is the event
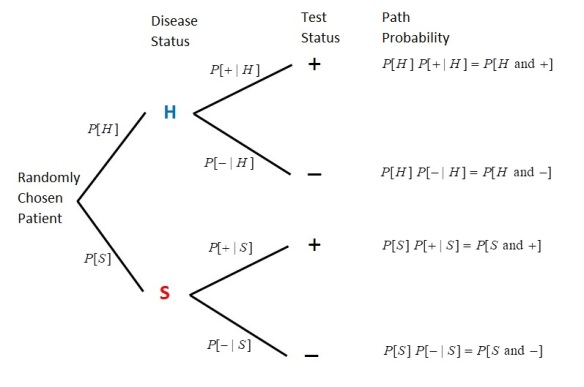
. The next diagram shows the probabilities that are in the tree diagram.
The probabilities at the first level of the tree are the unconditional probabilities and
, where
is the prevalence of the disease. The probabilities at the second level of the tree are conditional probabilities (the probabilities of the test status conditional on the disease status). A path probability is the product of the probabilities in a given path. For example, the path probability of the first path is
, which equals
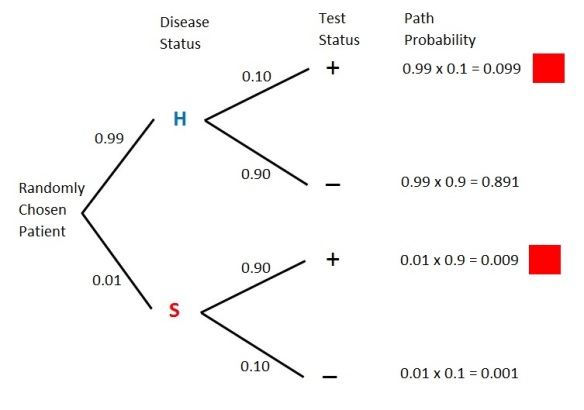
. Thus a path probability is the probability of the event “disease status and test status.” The next diagram displays the numerical probabilities.
Figure 3 shows four paths – “H and +”, “H and -“, “S and +” and “S and -“. With , the sum of the four path probabilities is 1.0. These probabilities show the long run proportions of the patients that fall into these 4 categories. The path that is most likely is the path “H and -“, which happens 89.1% of the time. This makes sense since the disease in question is one that has low prevalence (only 1%). The two paths marked in red are the paths for positive test status. Thus
. Thus about 10.8% of the patients being tested will show a positive result. Of these, how many of them actually have the disease?
In this example, the forward conditional probability is . As the tree diagrams have shown, the backward conditional probability is
. Of all the positive cases, only 8.33% of them are actually sick. The other 91.67% are false positives. Confusing the forward conditional probability as the backward conditional probability is a common mistake. In fact, sometimes medical doctors got it wrong according to a 1978 article in New England Journal of Medicine. Though we are using tree diagrams to present the solution, the answer of 8.33% is obtained by the Bayes’ formula. We will discuss this in more details below.
According to Figure 3, . Of these patients, how many of them are actually healthy?
Most of the negative results are actual negatives. So there are very few false negatives. Once gain, the forward conditional probability is not to be confused with the backward conditional probability
.
Bayes’ Formula
The result seems startling. Thus if a patient tested positive, there is only a slightly more than 8% chance that the patient actually has the disease! It seems that the test is not very accurate and seems to be not reliable. Before commenting on this result, let’s summarize the calculation implicit in the tree diagrams.
Though not mentioned by name, the above tree diagrams use the idea of Bayes’ formula or Bayes’ rule to reverse the forward conditional probabilities to obtain the backward conditional probabilities. This process has been discribed in this previous post.
The above tree diagrams describe a two-stage experiment. Pick a patient at random and the patient is either healthy or sick (the first stage in the experiment). Then the patient is tested and the result is either positive or negative (the second stage). A forward conditional probability is a probability of the status in the second stage given the status in the first stage of the experiment. The backward conditional probability is the probability of the status in the first stage given the status in the second stage. A backward conditional probability is also called a Bayes probability.
Let’s examine the backward conditional probability . The following is the definition of the conditional probability
.
Note that two of the paths in Figure 3 have positive test results (marked with red). Thus is the sum of two quantities with
. One of the quantities is for the case of the patient being healthy and the other is for the case of the patient being sick. With
, and plugging in
,
The above is the Bayes’ formula in the specific context of a medical diagnostic test. Though a famous formula, there is no need to memorize it. If using the tree diagram approach, look for the two paths for the positive test results. The ratio of the path for “sick” patients to the sum of the two paths would be the backward conditional probability .
Regardless of using tree diagrams, the Bayesian idea is that a positive test result is explained by two causes. One is that the patient is healthy. Then the contribution to a positive result is . The other cause of a positive result is that the patient is sick. Then the contribution to a positive result is
. The ratio of the “sick” cause to the sum total of the two causes is the backward conditional probability
. However, a tree diagram is clearly a very handy device to clarify the Bayesian calculation.
Further Discussion of the Example
The calculation in Figure 3 is based on the prevalence of the disease of 1%, i.e. . The hypothetical disease in the example affects one person in 100. With
being relatively small (just 8.33%), we cannot place much confidence on a positive result. One important point to understand is that the confidence on a positive result is determined by the prevalence of the disease in addition to the accuracy of the test. Thus the less common the disease, the less confidence we can place on a positive result. On the other hand, the more common the disease, the more confidence we can place on a positive result.
Let’s try some extreme examples. Suppose that we are to test for a disease that nobody has (think testing for ovarian cancer among men or prostate cancer among women). Then we would have no confidence on a positive test result. In such a scenario, all positives would be healthy people. Any healthy patient that receives a positive result would be called a false positive. Thus in the extreme scenario of a disease with 0% prevalence among the patients being tested, we do not have any confidence on a positive result being correct.
On the other hand, suppose we are to test for a disease that everybody has. Then it would then be clear that a positive result would always be a correct result. In such a scenario, all positives would be sick patients. Any sick patient that receives a positive test result is called a true positive. Thus in the extreme scenario of a disease with 100% prevalence, we would have great confidence on a positive result being correct.
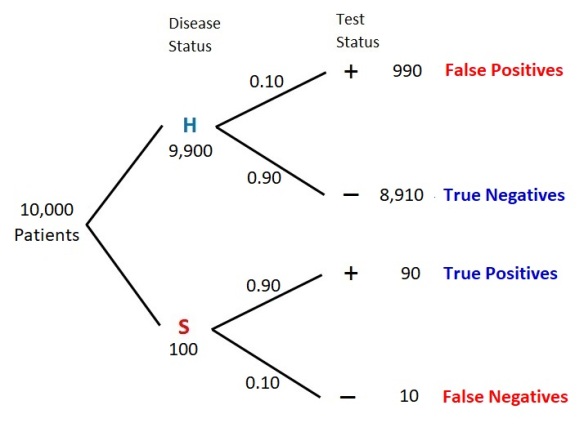
Thus prevalence of a disease has to be taken into account in the calculation for the backward conditional probability . For the hypothetical disease discussed here, let’s look at the long run results of applying the test to 10,000 patients. The next tree diagram shows the results.
Out of 10,000 patients being tested, 100 of them are expected to have the disease in question and 9,900 of them are healthy. With the test being 90% accurate, about 90 of the 100 sick patients would show positive results (these are the true positives). On the other hand, there would be about 990 false positives (10% of the 9,900 healthy patients). There are 990 + 90 = 1,080 positives in total and only 90 of them are true positives. Thus is 90/1080 = 8.33%.
What if the disease in question has a prevalence of 8.33%? What would be the backward conditional probability assuming that the test is still 90% accurate?
With , there is a great deal more confidence on a positive result. With the test accuracy being the same (90%), the greater confidence is due to the greater prevalence of the disease. With
being greater than 0.01, a greater portion of the positives would be true positives. The higher the prevalence of the disease, the greater the probability
. Just to further illustrate this point, suppose the test for a disease has a 90% accuracy rate and the prevalence for the disease is 45%. The following calculation gives
.
With the prevalence being 45%, the probability of a positive being a true positive is 88%. The calculation shows that when the disease or condition is widespread, a positive result should be taken seriously.
One thing is clear. The backward conditional probability is not to be confused with the forward conditional probability
. Furthermore, it will not be easy to invert the forward conditional probability without using Bayes’ formula (either using the formula explicitly or using a tree diagram).
Bayesian Updating Based on New Information
The calculation shown above using the Bayes’ formula can be interpreted as updating probabilities in light of new information, in this case, updating risk of having a disease based on test results. With the hypothetical disease having a prevalence of 1% being discussed above, the initial risk is 1%. With one round of testing using a test with 90% accuracy, the risk is updated to 8.33%. For the patients who test positive in the first round of testing, the risk is raised to 8.33%. They can then go through a second round of testing using another test (but also with 90% accuracy). For the patients who test positive in the second round, the risk is updated to 45%. For the positives in the third round of testing, the risk is updated to 88%. The successive Bayesian calculation can be regarded as sequential updating of probabilities. Such updating would not be easy without the idea of the Bayes’ rule or formula.
Sensitivity and Specificity
The sensitivity of a medical diagnostic test is the ability to give correct results for the people who have the disease. Putting it in another way, the sensitivity is the true positive rate, which would be the percentage of sick people who are correctly identified as having the disease. In other words, the sensitivity of a test is the probability of a correct test result for the people with the disease. In our discussion, the sensitivity is the conditional forward probability .
The specificity of a medical diagnostic test is the ability to give correct results for the people who do not have the disease. The specificity is then the true negative rate, which would be the percentage of healthy people who are correctly identified as not having the disease. In other words, the specificity of a test is the probability of a correct test result for healthy people. In our discussion, the specificity is the conditional forward probability .
With the sensitivity being the conditional forward probability , the discussion in this post shows that the sensitivity of a test is not the same as backward conditional probability
. The sensitivity may be 90% but the probability
can be much lower depending on the prevalence of the disease. The sensitivity only tells us that 90% of the people who have the disease will have a positive result. It does not take into account of the prevalence of the disease (called the base rate). The above calculation shows that the rarer the disease (the lower the base rate), the lower the likelihood that a positive test result is a true positive. Likewise, the more common the disease, the higher the likelihood that a positive test result is a true positive.
In the example discussed here, both the sensitivity and specificity are 90%. This scenario is certainly ideal. In medical testing, the accuracy of a test for a disease may not be the same for the sick people and for the healthy people. For a simple example, let’s say we use chest pain as a criterion to diagnose a heart attack. This would be a very sensitive test since almost all people experiencing heart attack will have chest pain. However, it would be a test with low specificity since there would be plenty of other reasons for the symptom of chest pain.
Thus it is possible that a test may be very accurate for the people who have the disease but nonetheless identify many healthy people as positive. In other words, some tests have high sensitivity but have much lower specificity.
In medical testing, the overriding concern is to use a test with high sensitivity. The reason is that a high true positive rate leads to a low false negative rate. So the goal is to have as few false negative cases as possible in order to correctly diagnose as many sick people as possible. The trade off is that there may be a higher number of false positives, which is considered to be less alarming than missing people who have the disease. The usual practice is that a first test for a disease has high sensitivity but lower specificity. To weed out the false positives, the positives in the first round of testing will use another test that has a higher specificity.
2017 – Dan Ma


